CCMMdb and CCMMwiki are the design toolkits for collagen scaffold developed as outcome of the EPSRC-funded Scaffold DoCTR fellowship awarded to Prof. Ruth Cameron and Prof. Serena Best. A limited access public version of CCMMwiki and CCMMdb is now available at https://simple.ccmm.wiki.
CCMMwiki
CCMMwiki is the Cambridge Centre of Medical Materials’ in-house tool containing background and theoretical information, as well as the experimental protocols and characterisation tools utilised within the group. The aim of CCMMwiki is to enable group members to share expertise and learn new methods rapidly, particularly within the context of tissue engineering scaffolds and biomaterials research. CCMMwiki also aims to help new members get up to speed with the research themes of the group. CCMMwiki is collaboratively managed and edited by the members of CCMM.
CCMMdb
Introduction
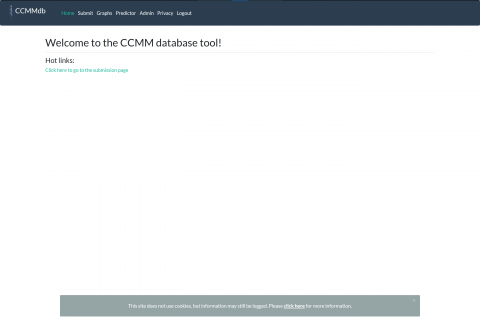
CCMMdb is a novel database operated and managed by the Cambridge Centre of Medical Materials. Currently the database is set up to collect and collate raw data pertaining to the fabrication as well as structural and mechanical properties of collagen-based iced templated scaffolds for tissue engineering. The aim of the database is to provide a toolkit for tissue regeneration. This is achieved through two features: The filtered graphing tool and a predictor tool for structure and mechanics.
Data Submission
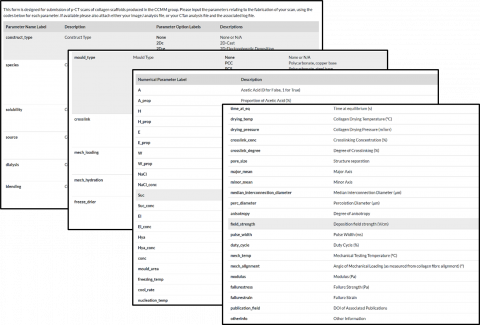
The data submission tool includes a long list of fabrication and characterisation parameters whose values can be recorded and entered for submission into the database. The large parameter space aims to be comprehensive, in order to encourage users to record and highlight parameters which are known to have significant impact on structural or mechanical properties. Although the list in its current form is long, it is far from exhaustive, and still offers sufficient flexibility for users to choose which parameters they wish to input based on what measurements they have collected.
The tool also allows for the batch upload of data that is consistent with the parameter codes introduced in the database. The submission page also includes the facility to upload raw pore size analyses files (if performed using CTAn or Image J) and also houses the capability to accept raw mechanical testing data and thermocouple measurements during freezing.
Data Visualisation
Three interactive graphs can be produced using CCMMdb:
Plot 1: A simple property-relationship graph (e.g. collagen concentration vs. pore size)
Plot 2: Continuous data plots of any data provided (e.g. stress-strain, time-temperature thermocouple data)
Plot 3: A scatter matrix plot of key parameters in the database
You can select the variables to place along the x and y axes for Plot 1. You can also select a categorical variable by which the Plots 1, 2 and 3 are colour coded. Once plotted, you can choose to zoom in and pan around the graphs and view extra information by hovering your cursor over your data point of interest. You can also click on the legends to deselect data points belonging to a particular category, or double click them to isolate their corresponding traces. You can also take a snapshot of the graphs as you view them using the toolbar at the top right of the graphs.
These graphs can also be updated to only display a subset of interest, using the filtering functionality of in CCMMdb.
A demonstration of the plotting and filtering interfaces are shown in the video below:
Data Prediction
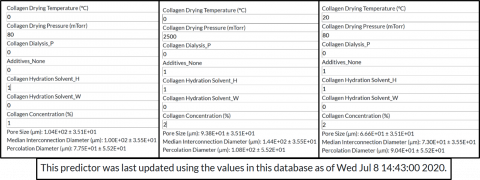
CCMMdb operates two prediction tools, a structure predictor, for the pore size, percolation diameter and median interconnection diameter, and a mechanics predictor, for the Young's modulus, failure strength and failure strain. These predictors are random forest regressors trained directly on values from the database entries with unique values.
Categorical variables should be entered based on the absence (0) or the presence (1) of the variable after the '_'. For example, currently the tool is equipped to handle three solvents: hydrochloric acid (H), acetic acid (A), and water(W). If the solvent used is acetic acid (i.e., neither HCl nor Water), then the corresponding values for Collagen Solvent_H and Collagen Solvent_W should both be 0. If the solvent used is water, then Collagen Solvent_H should be 0 while Collagen Solvent_W should be 1.
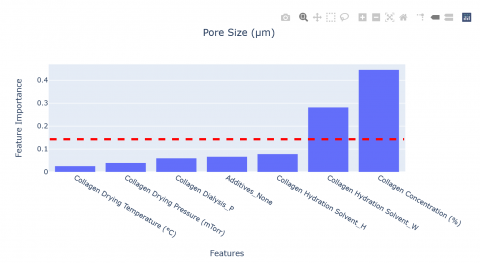
Feature importance graphs for both predictors are also provided to identify the variables that most significantly affect the output predictions. For comparison, the mean feature importance is plotted as a red vertical line. As a first estimate, the most influential features can be identified as those with importances above the mean.
To be efficient with computation time, the models are trained once every month on a cleaned version of the database at that point in time. Further information on when the models were last updated is provided next to each set of predictions.
A quick demo of the real-time predictions obtained with the tool can be observed in the video below:

